My passion is understanding the numbers and trends behind the Buisness Model using data.
Table of Contents
📜 Certifications
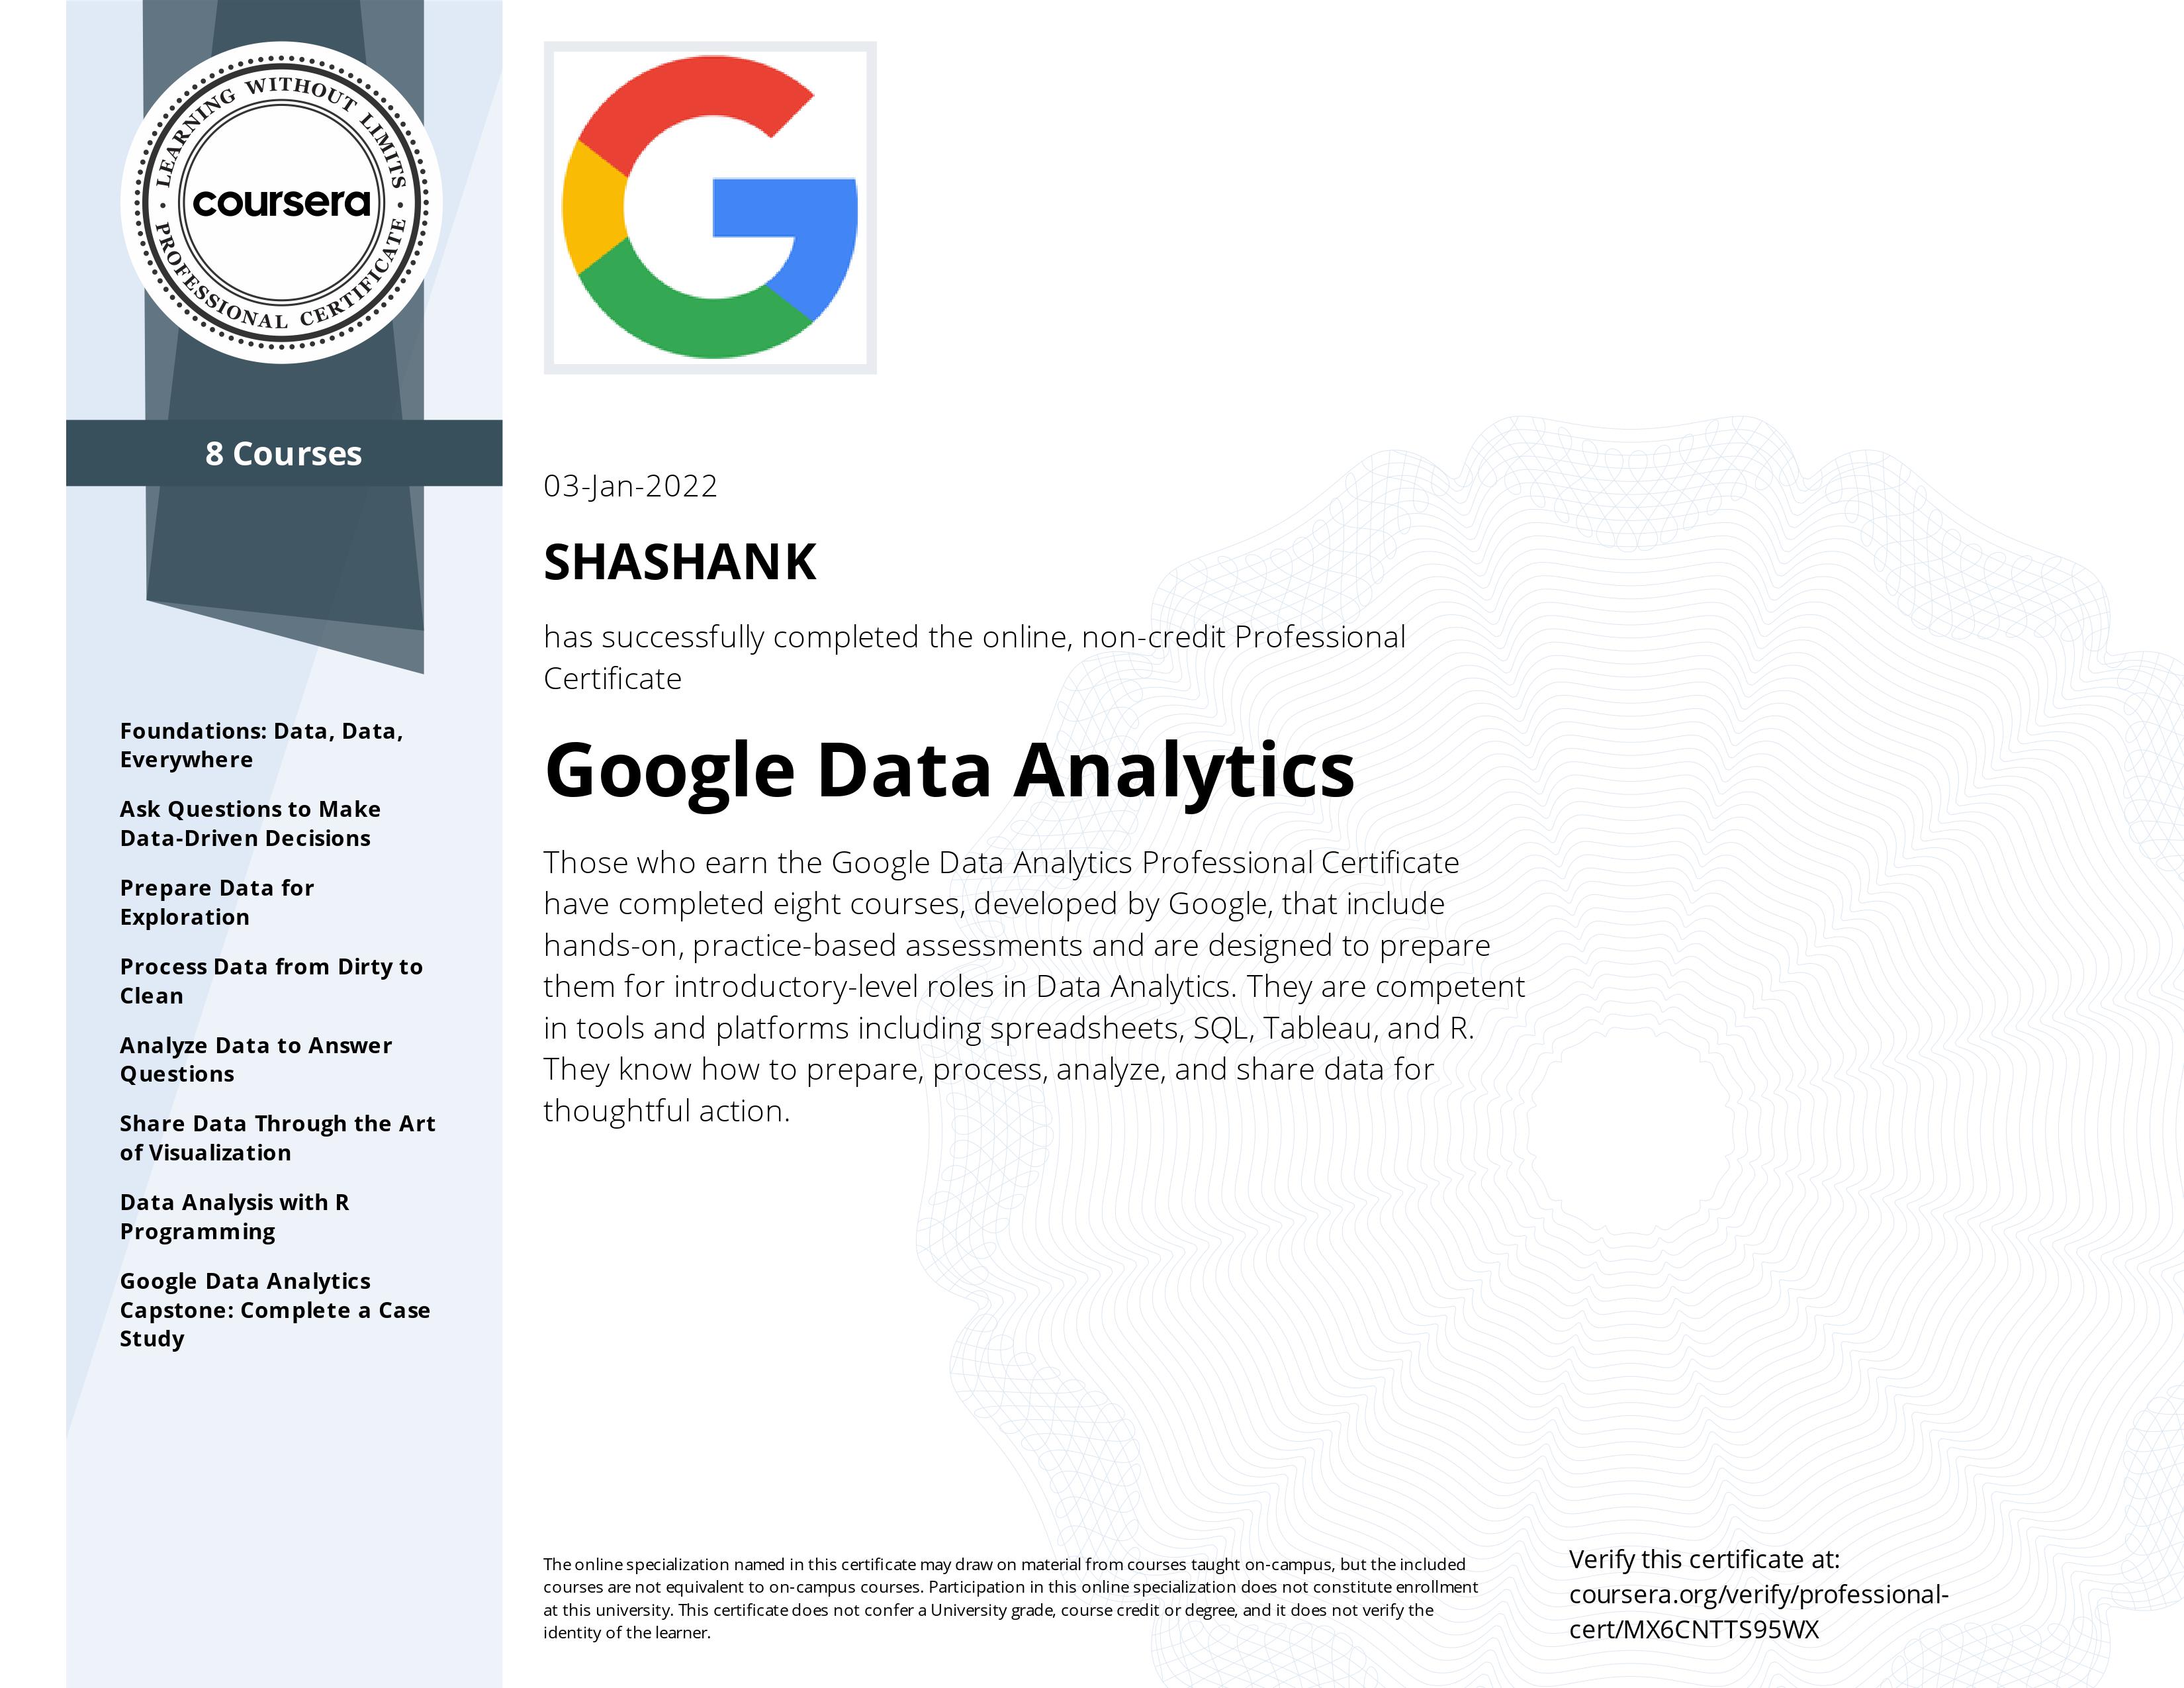
1. Google Data Analytics Specialization (Coursera)
-
Gained an immersive understanding of the practices and processes used by a junior or associate data analyst in their day-to-day job
-
Learnt key analytical skills (data cleaning, analysis, & visualization) and tools (spreadsheets, SQL, R programming, Tableau)
-
Understood how to clean and organize data for analysis, and complete analysis and calculations using spreadsheets, SQL and R programming
-
Learnt how to visualize and present data findings in dashboards, presentations and commonly used visualization platforms
2. Python Certification (Hackerrank)
- Covers topics like Scalar Types, Operators and Control Flow, Strings, Collections and Iteration, Modularity, Objects and Types and Classes
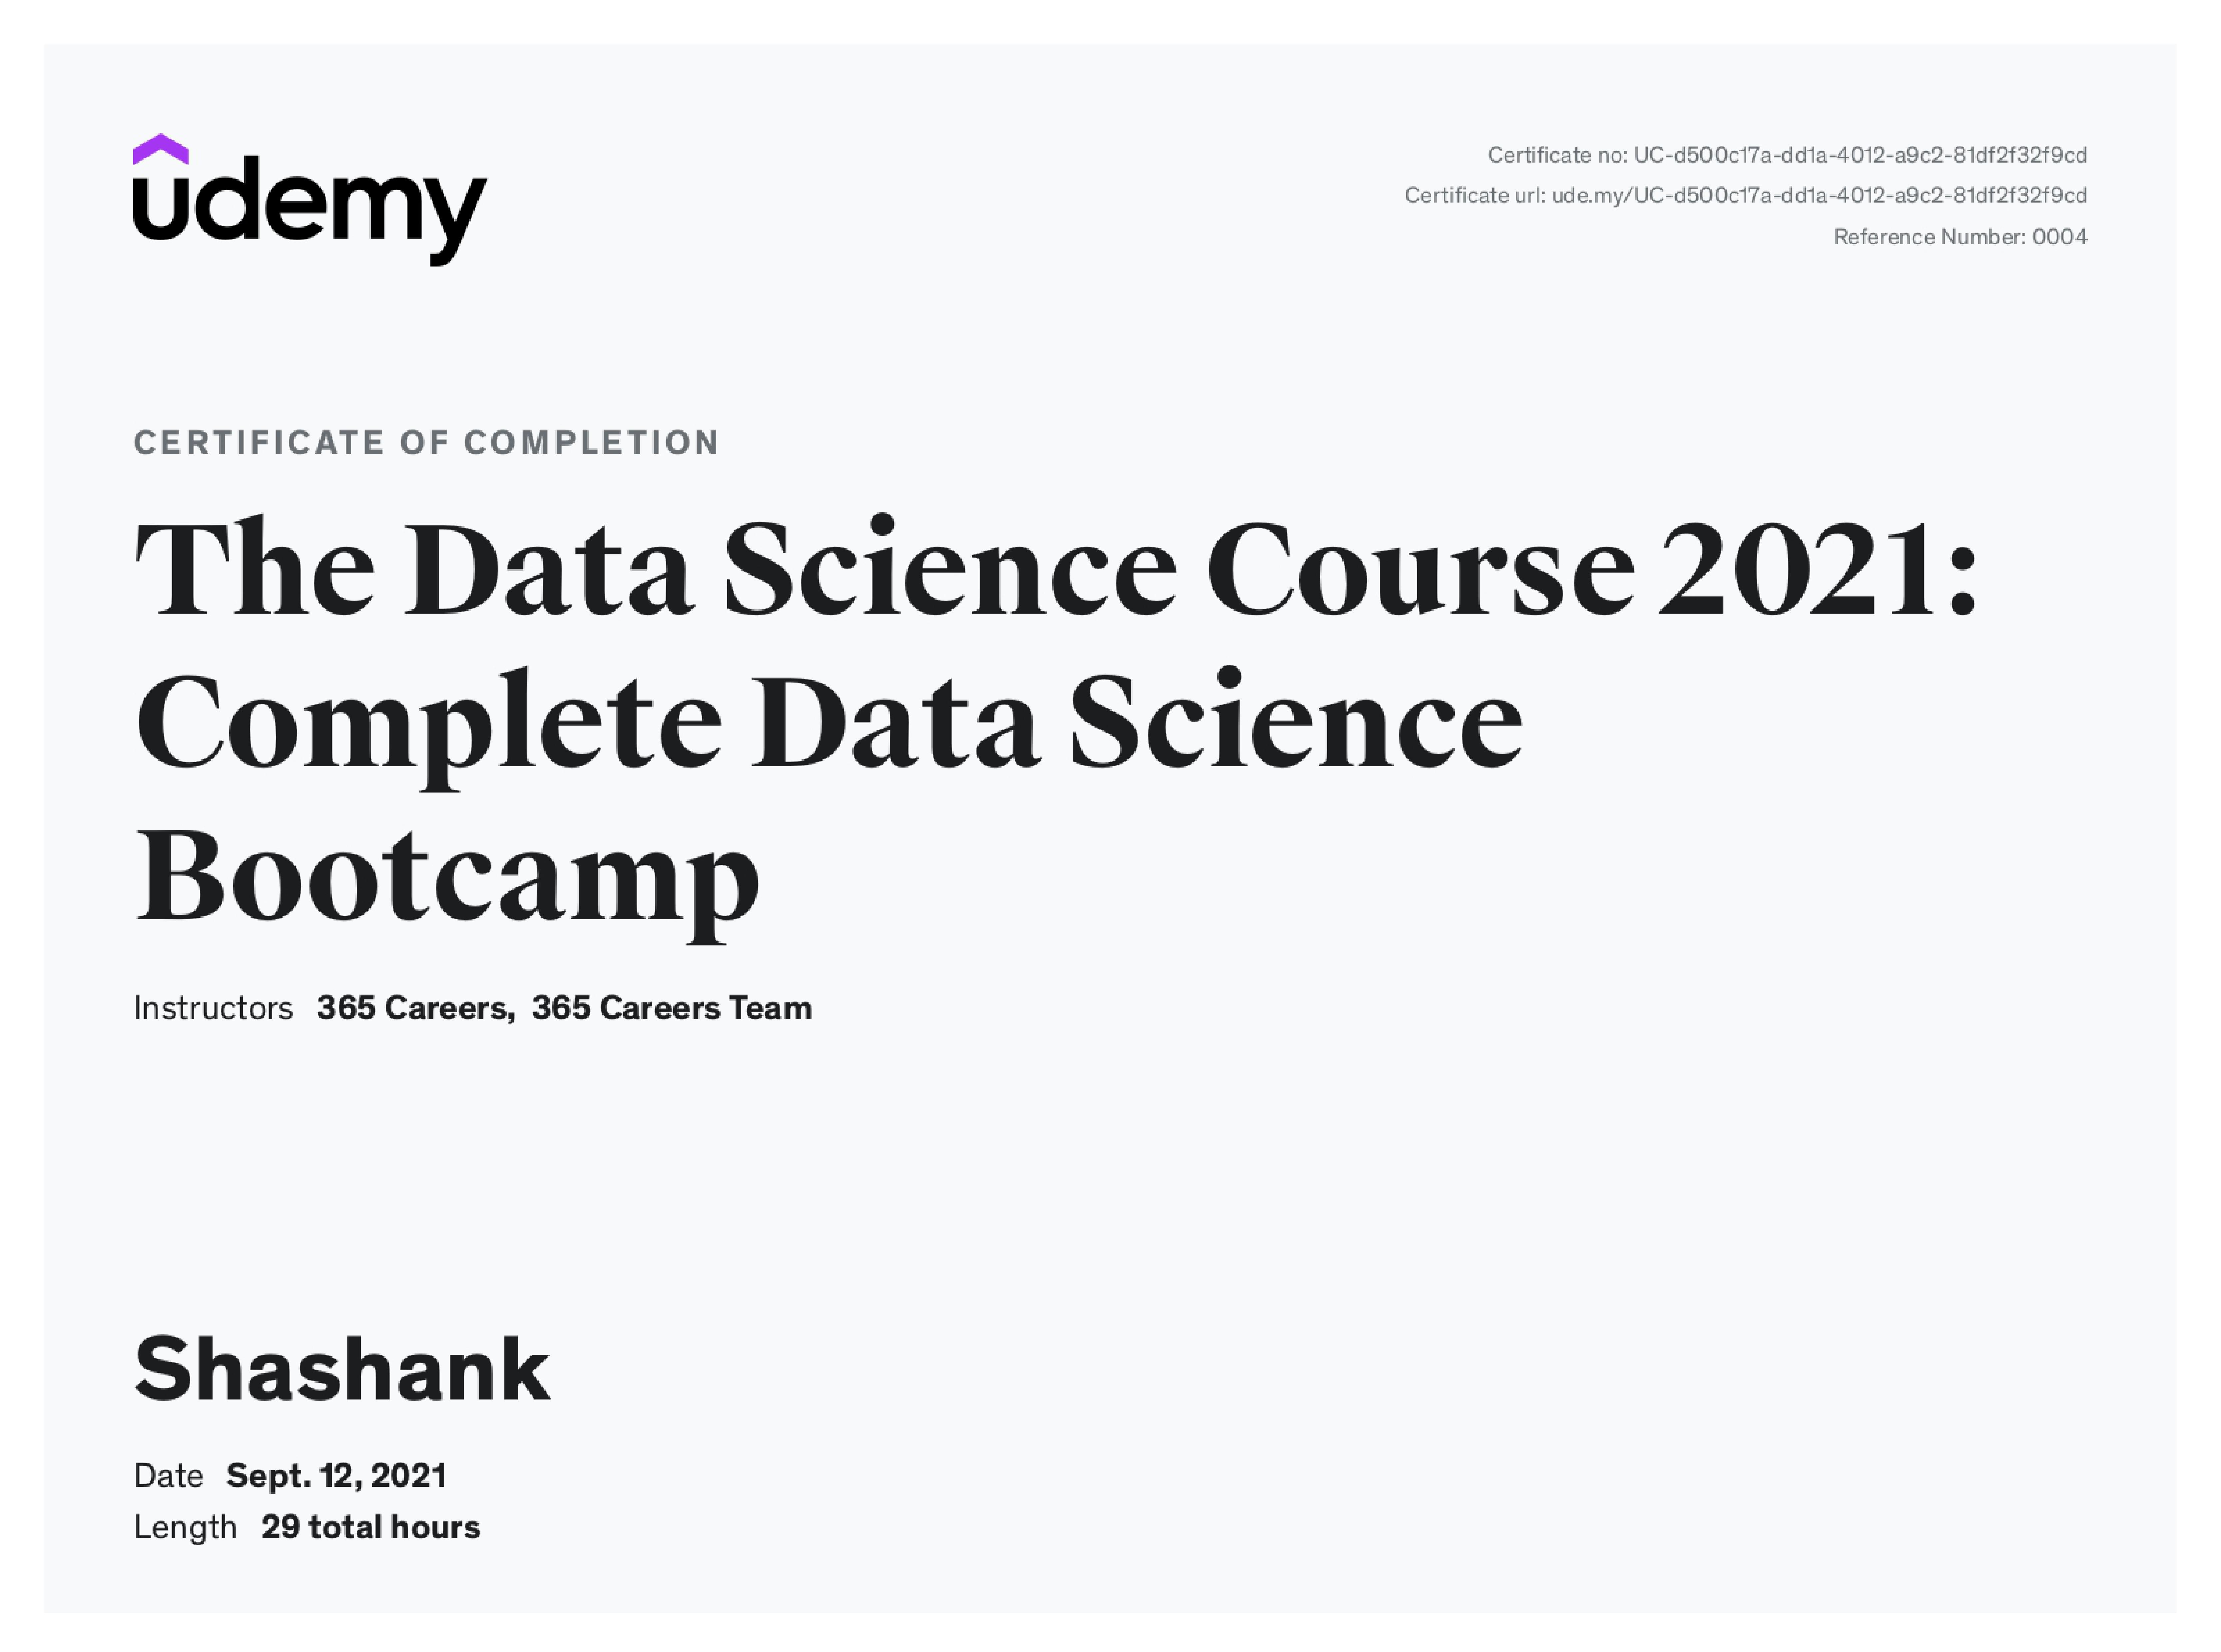
3. Basics of Data Science (UpGrad)
- Worked on Real‑Life Case Studies & Complications during the course of Training.
- Completed 3 Projects/Assignments on time during the span of 2 months.
- Studied about Tableau Desktop and made Visualizations using the tool.
- Learnt Data Analysis Using Microsoft Excel, Python
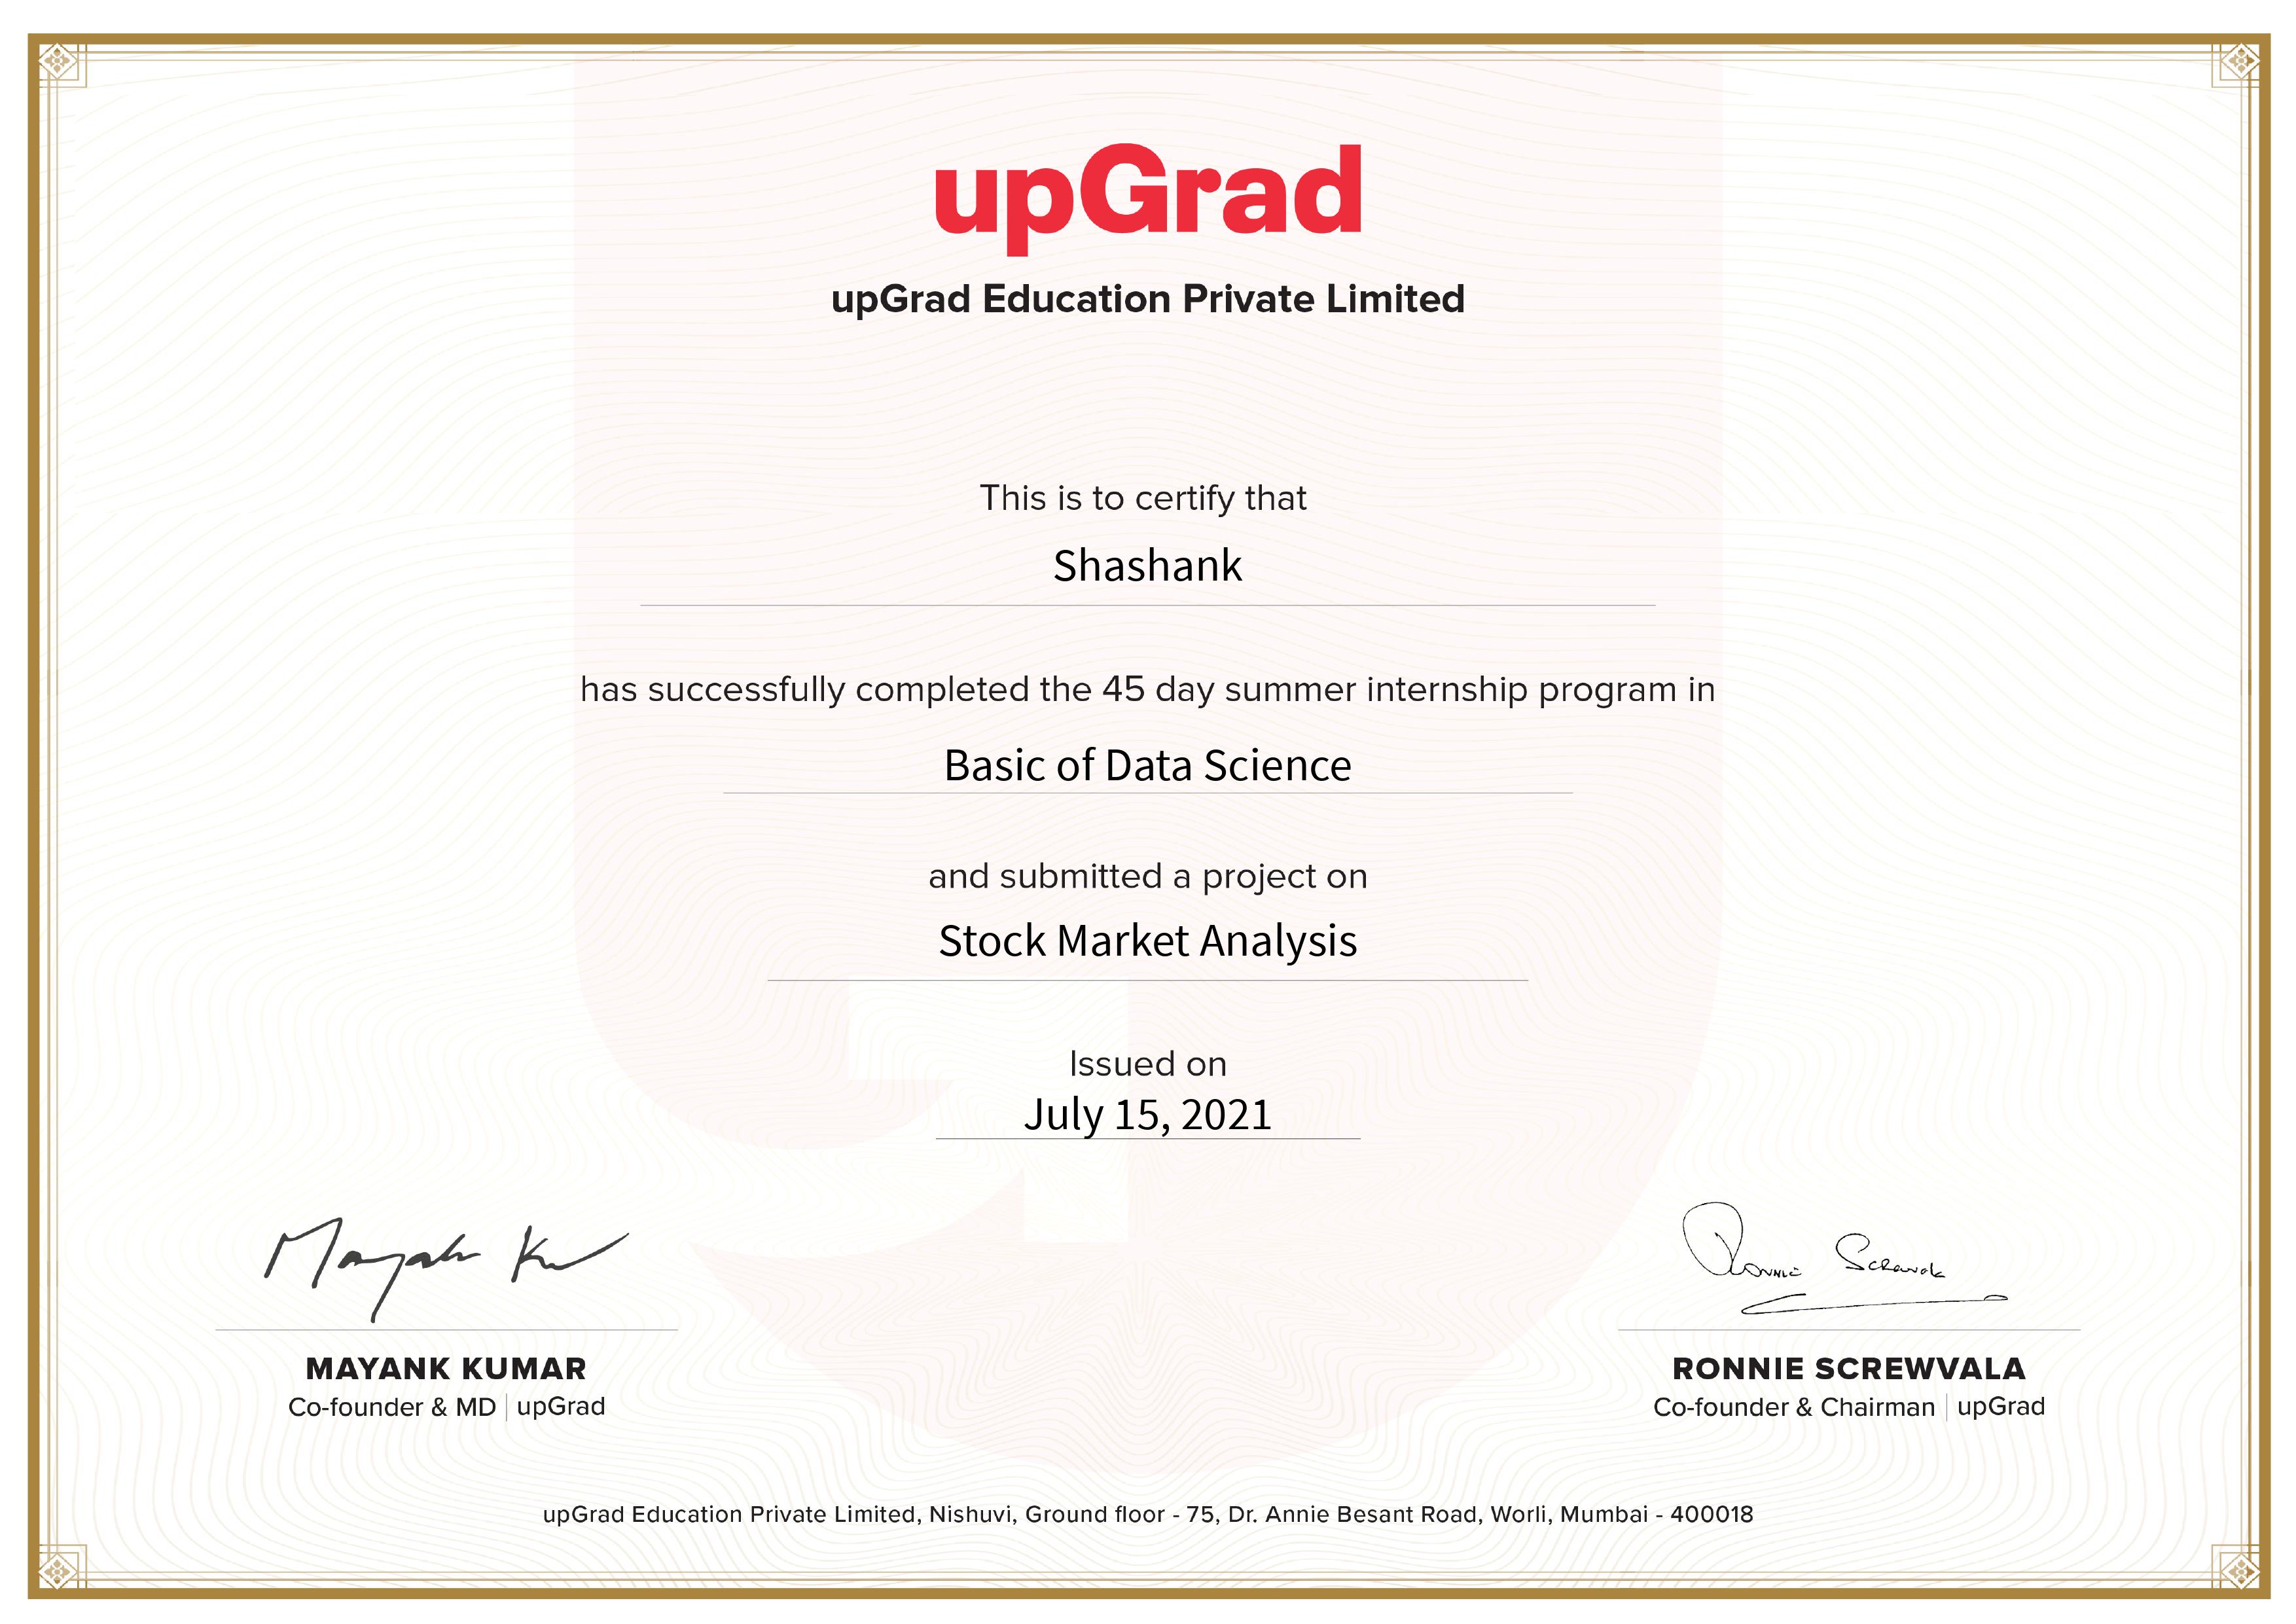
4. Trainity Virtual Internship
- Worked on Business Case Studies & Problems during the course of Training.
- Completed 6 tasks and modules during the span of 8 weeks.
- Segmented the data set provided and drew unique insights using visualization tools.
- Learned Excel, Python in depth.
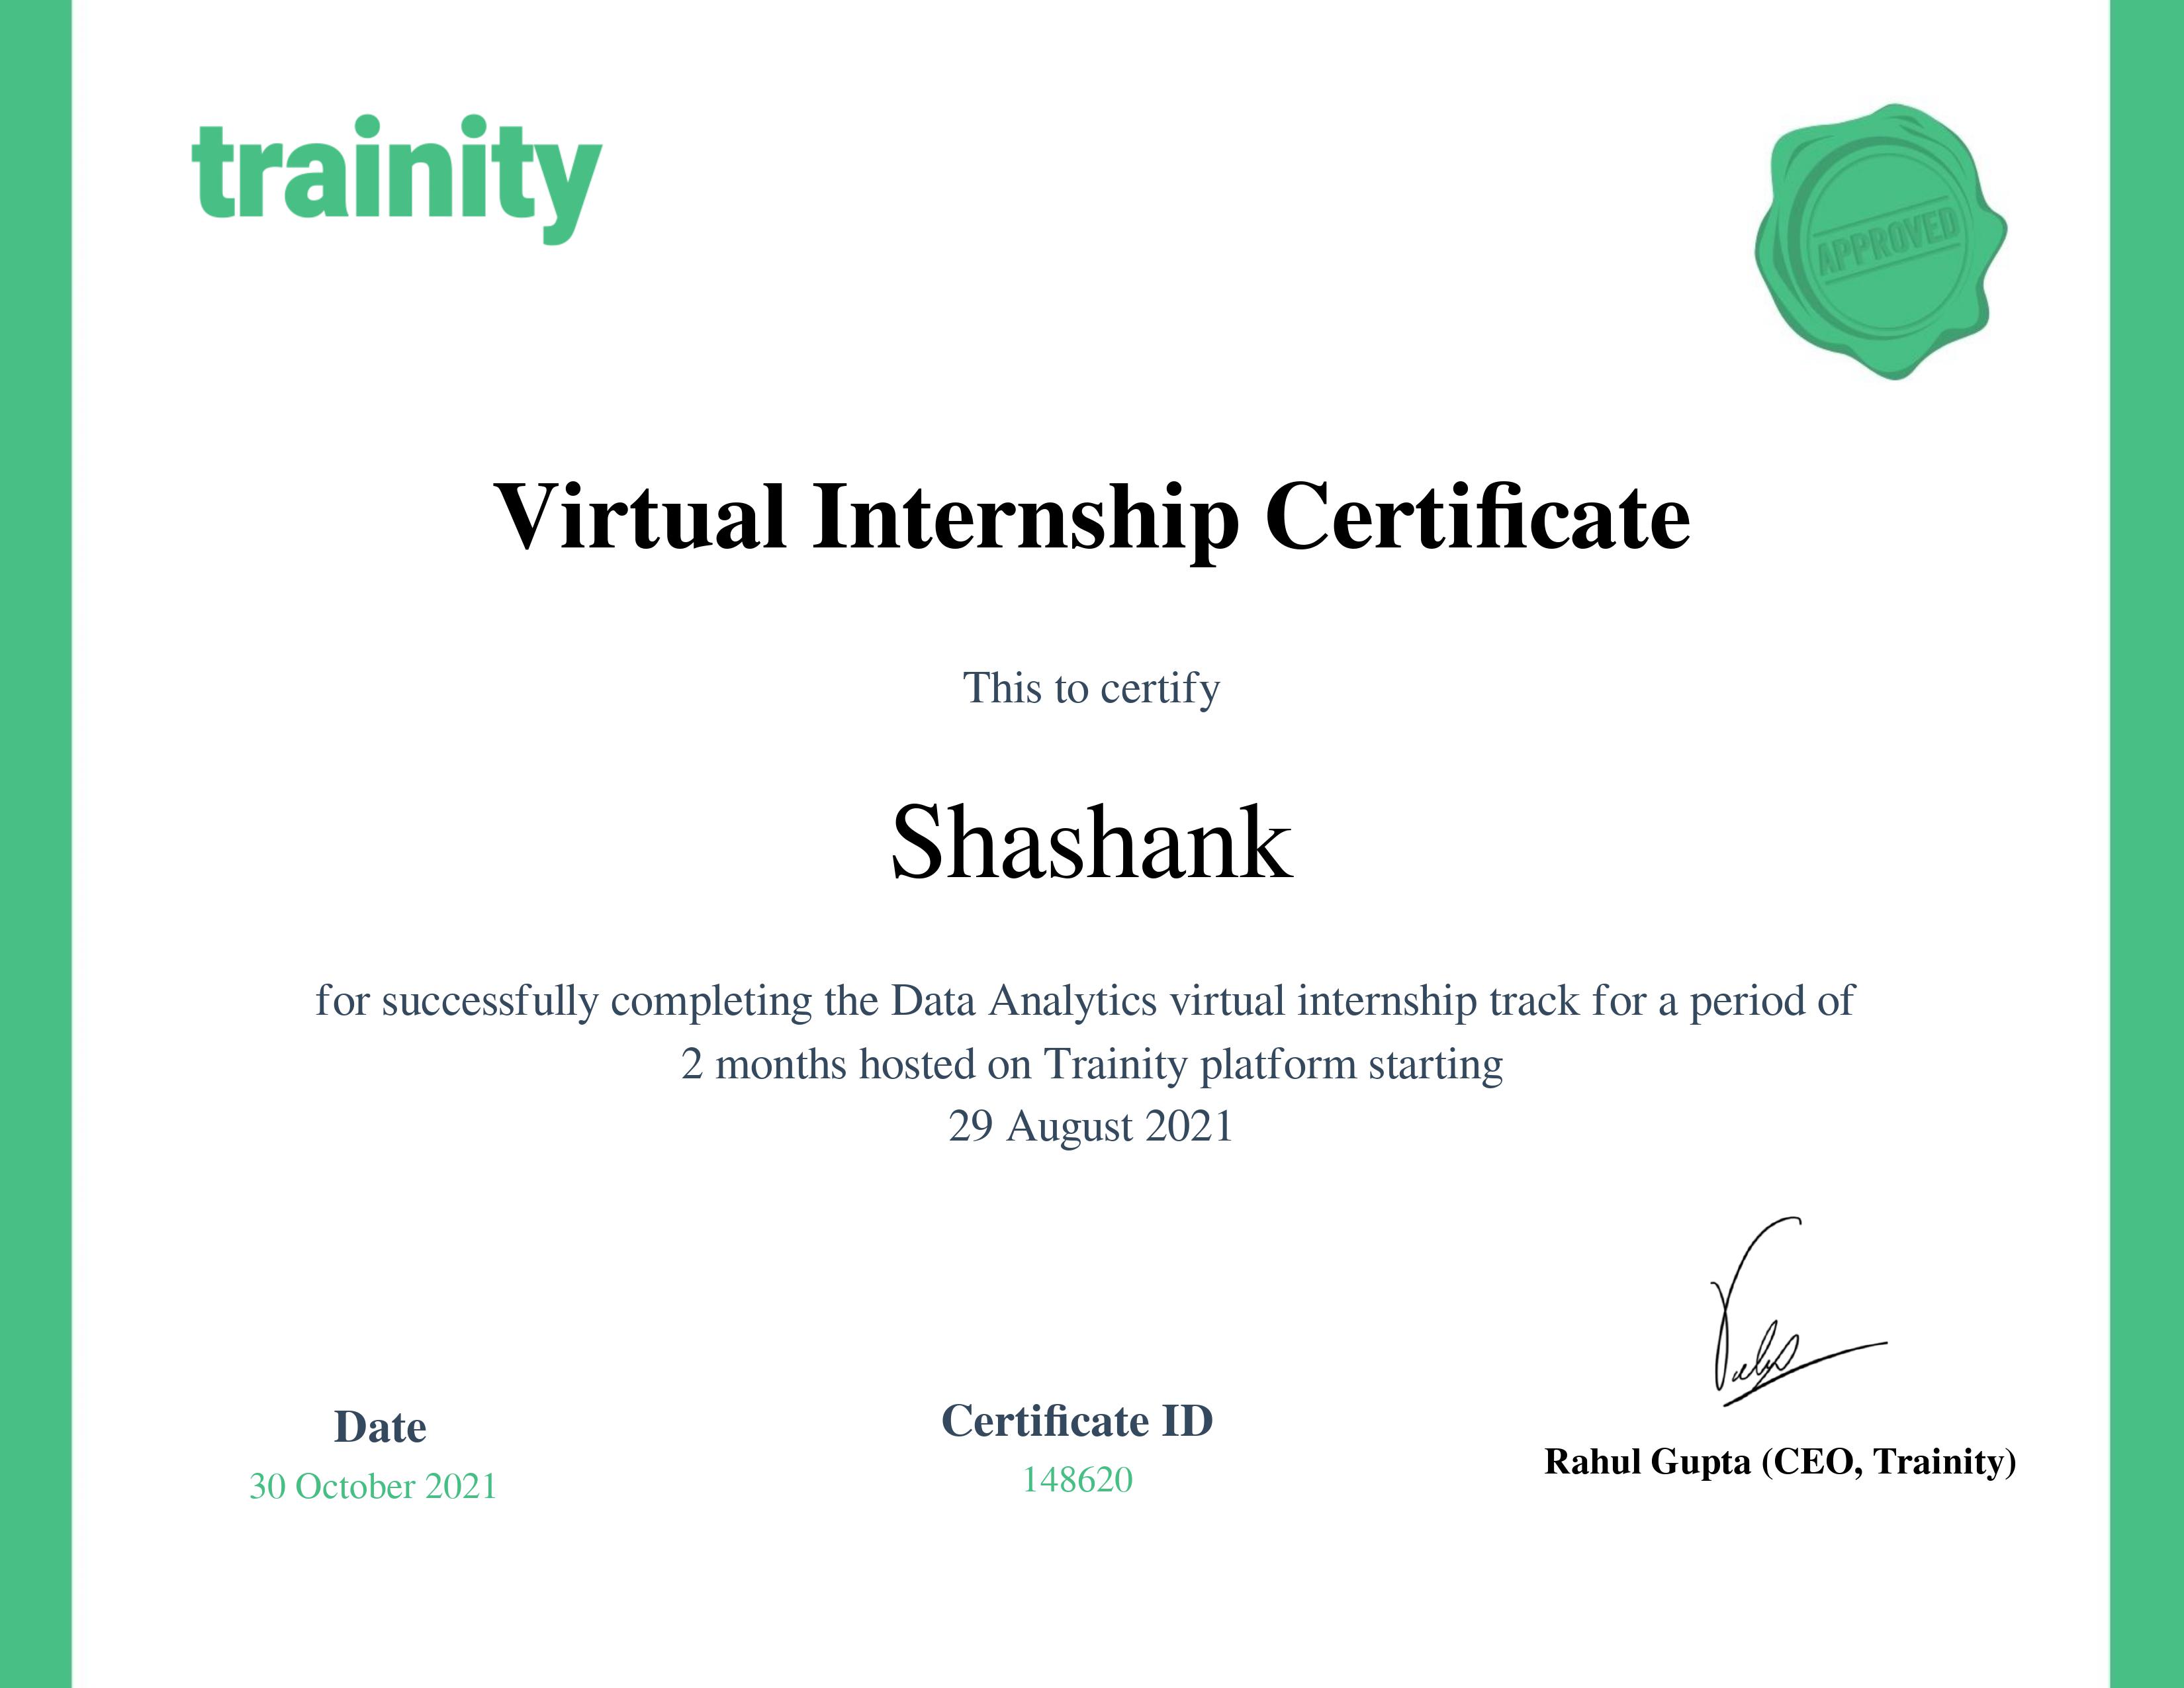
5. Trainity Data Analytics Specialized
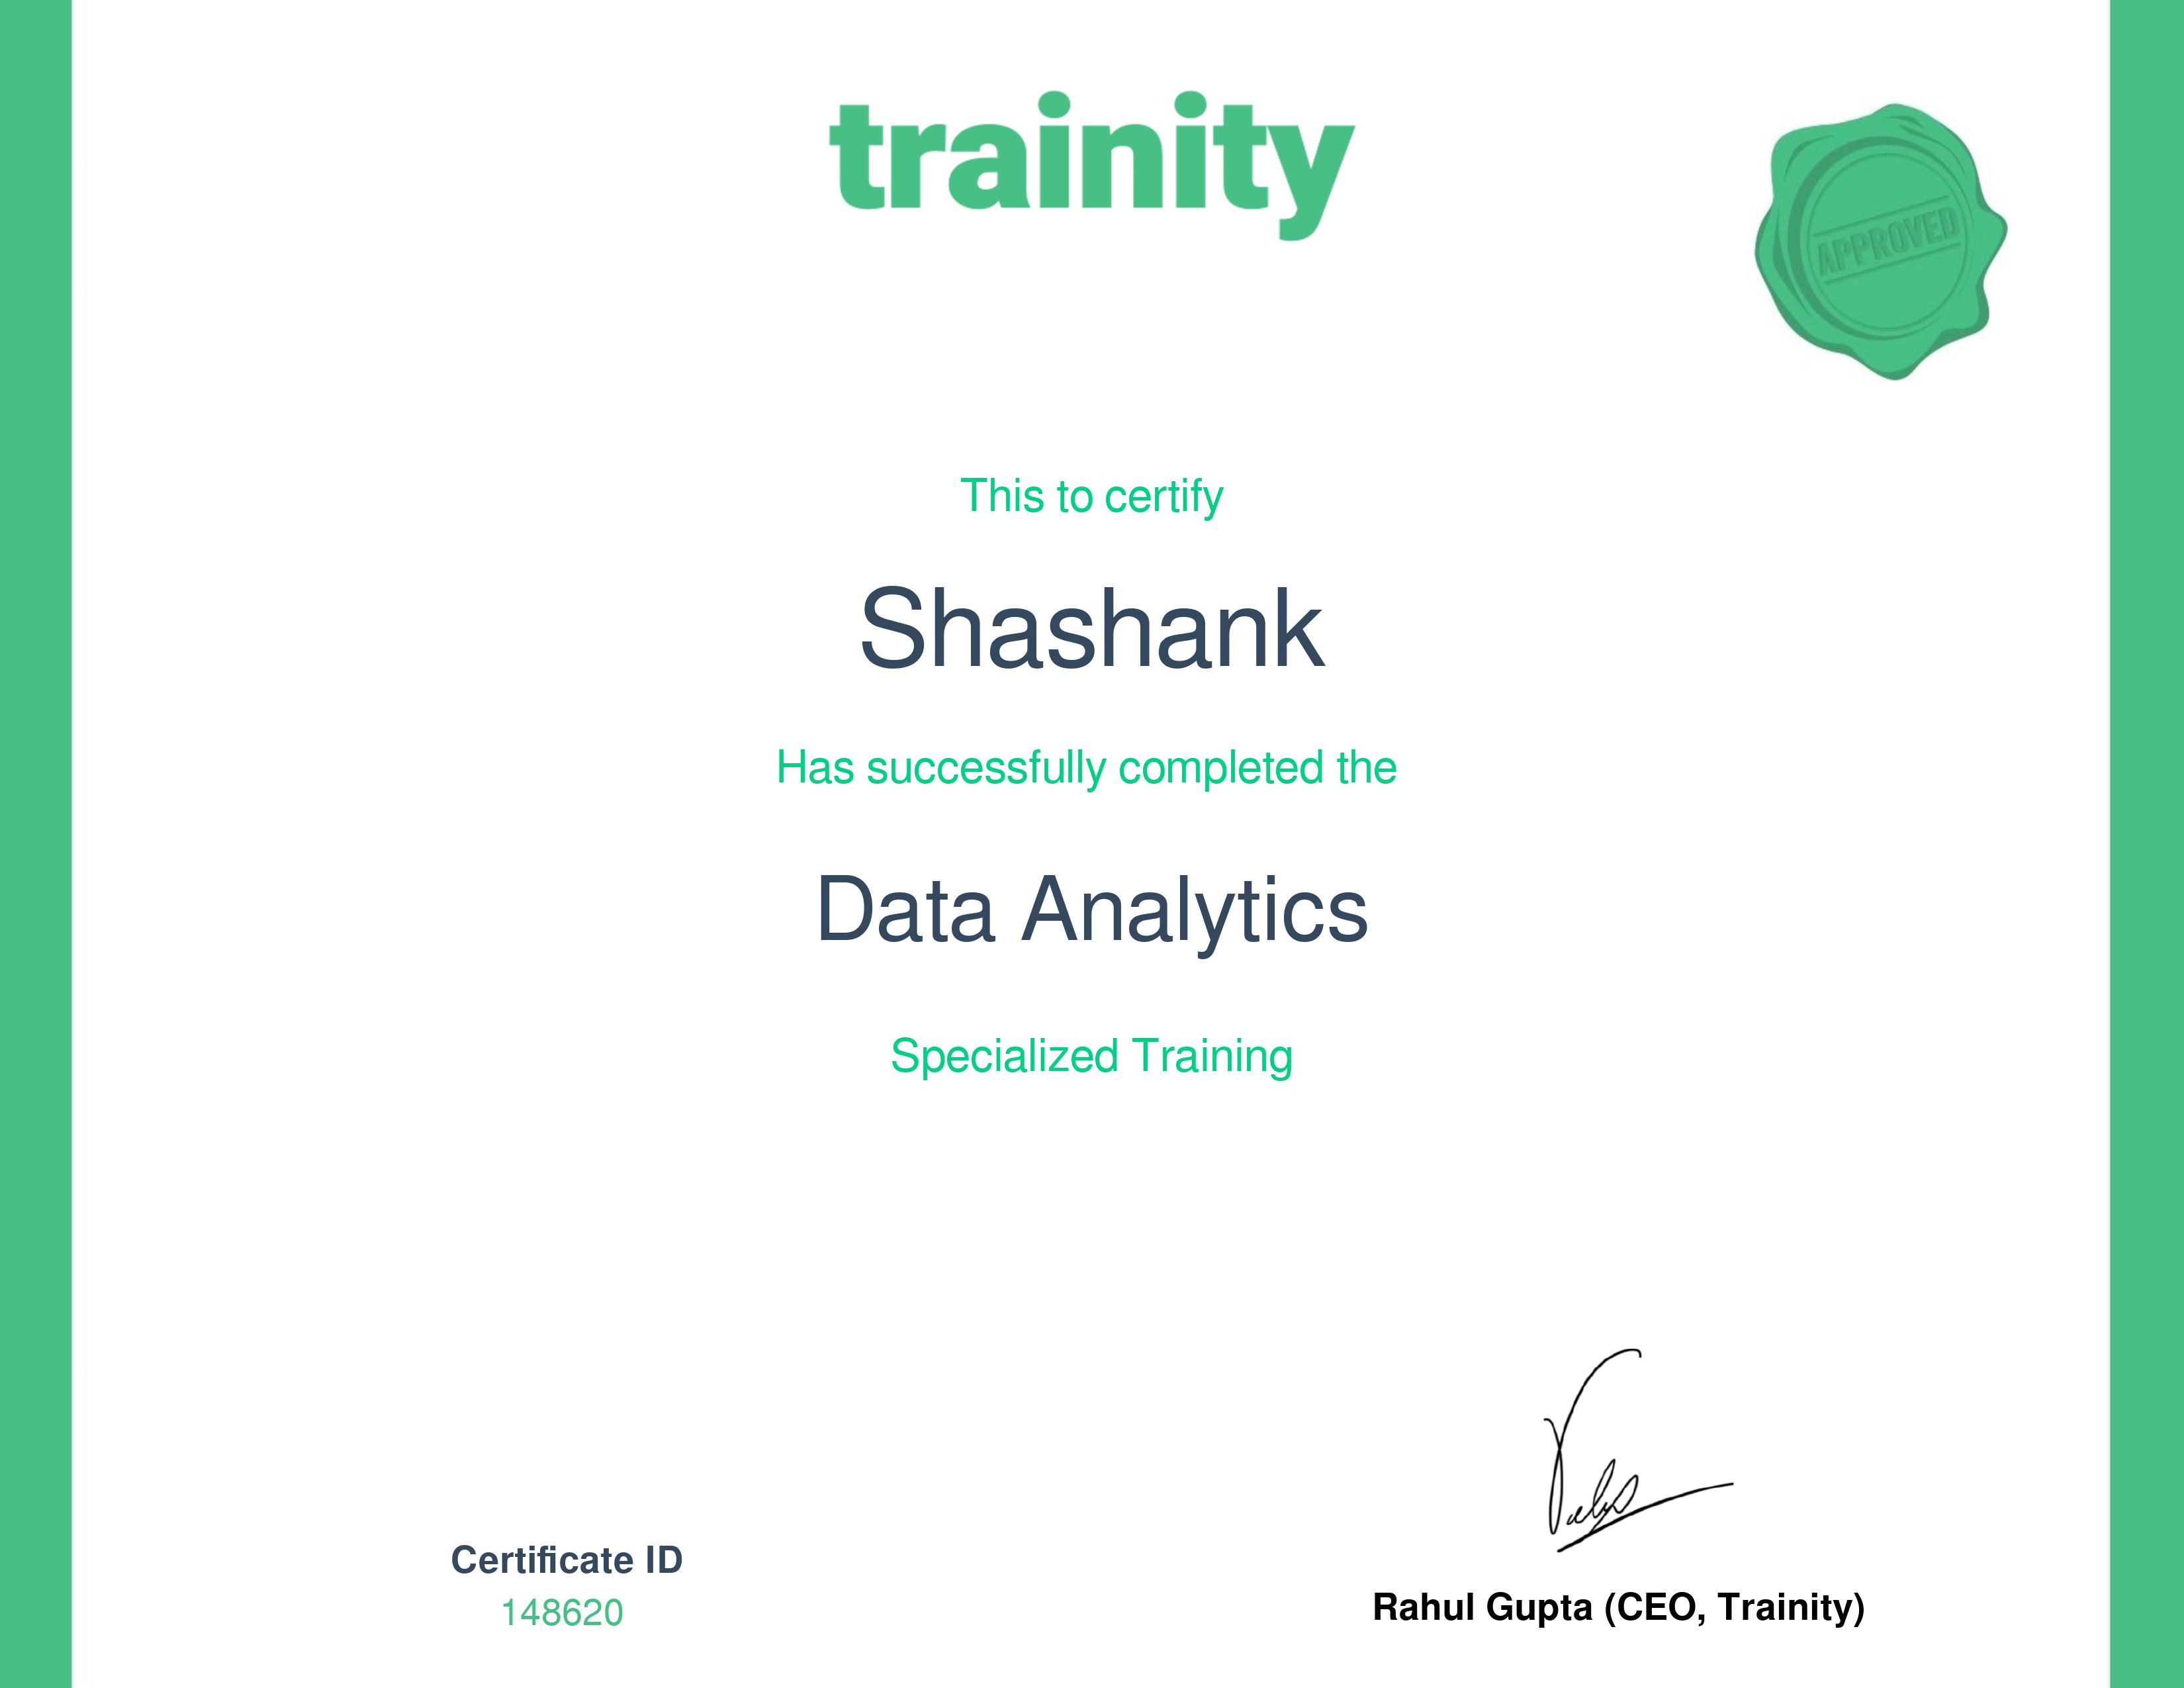
6. The Data Science Course (Udemy)
✏️ Skills
- Programming: Python (Pandas, Numpy, sklearn, SciPy), SQL (MySQL), R
- Data Visualization: Tableau Desktop, Matplotlib, Seaborn
- IDEs: Jupyter Notebook, Visual Studio Code, RStudio
- Applicable Software: Tableau Prep Builder, Microsoft Office (Word, Excel, PowerPoint)
💻 Portfolio Projects
1. Case Study: How Does a Bike-Share Navigate Speedy Success ? 🔗
- This is Captone Project for Google Data Analytics Professional Certificate.
- Analyzed a total of 16 Datasets of 1 GB.
- Segmented analysis in 6 phases.
- Cleaned & Prepared Datasets for Analysis using Python containing 6,044,091 entries.
- Analyzed and Visualized Data in 6 Different Graphs with the help of Tableau Desktop.
- Provided 5 Key-Takeaways and 3 Recommendations.
- For project in detail, visit this project link.
2. Case Study: How Airbnb can attract Tourists in NYC ? 🔗
- Analyzed a data publicly available on Kaggle: New York City Airbnb Open Data(Airbnb listings and metrics in NYC, NY, USA (2019)).
- Segmented analysis in 5 phases.
- Cleaned & Prepared Datasets for Analysis using Python containing 48,895 entries.
- Analyzed and Visualized Data in 11 Different Graphs with the help of Tableau Desktop.
- Provided 7 Key-Insights and 4 Suggestions.
- For project in detail, visit this project link.
3. Movies Recommendation System 🔗
- Built a Model using Python for Recommending Movies over a data of 5000 Movies.
- Used “TMDB.com” API for requesting 5 Movie Posters for each movie recommendation search.
- Deployed & Hosted the Application on “Heroku.com”.
- For project in detail, visit this project link.
4. Laptop Price Predictor 🔗
- Built a Model using Python for Predicting Prices of Laptops based on different user inputs.
- Used this dataset containing information of 1300 different laptops.
- Deployed & Hosted the Application on “Heroku.com”.
- For project in detail, visit this project link.
5. Weather Application 🔗
- Built an application for representing different weather related information based on user input.
- Used Open Weather Map API for requesting weather related informations of different cities around the globe.
- Deployed & Hosted the Application on “Heroku.com”.
- Project Link - https://ssk-weather-app.herokuapp.com/
6. Credit Card Fraud Detection Model 🔗
- Built a model on Kaggle for detecting whether a transaction is Legit or Fraud.
- Analyzed a total of 2,84,807 transactions information.
- Segmented analysis in 6 phases.
- Cleaned & Prepared Datasets for model training which included under-sampling of dataset.
- Analyzed and splitted the dataset into Train & Test data using sklearn library.
- Checked for the accuracy score of Predicted data given by the model.
- For project in detail, visit this project link.
7. Customer Segmentation using KMeans 🔗
- Project to segment customers of a mall on the basis of their gender, age, annual income & spending score using KMeans.
- Analyzed a total of 200 entries of dataset.
- Segmented analysis in 5 phases.
- Cleaned & Prepared the Dataset.
- Analyzed and divided dataset into ranges and visualized it on graph.
- Checking for relationships.
- Finding the numbers of clusters needs to be created
- Visualizing the clusters on graphs
- For project in detail, visit this project link.

.png)
